More sales
Continuous output, a product with a story
Planned successions and reliable deliveries, batch QR and showcase so buyers and retailers pick you.
Blue Circle Software
Manage your crops, collect data, monitor performance and build a documentation base ready for analysis and certification.
14-day trial with all features · No card required to start · Already have an account? Log in
Access
Enter your dashboard: daily priorities, batches, greenhouse map, calendar, analytics, QR codes and the AI assistant. If you don't have an account yet, signing up starts the free trial right away.
Product demo
The main screens of the Blue Circle application: what they show, what you do with them and what changes in daily work.
Dashboard
Direct benefit
Open the software and you immediately know what to do: no walk-around to figure out the state of the facility.
Greenhouse view (live)
Direct benefit
You plan sowing and transplanting on real capacity: no forgotten positions, no wasted space.
Outcomes
Blue Circle Software is not an archive: it moves the farm's numbers. Here is what changes when production, data and documentation live in one place.
More sales
Planned successions and reliable deliveries, batch QR and showcase so buyers and retailers pick you.
Fewer hours
Assigned tasks, automatic records and instant search: transcription work disappears.
Less water and nutrients
EC/pH readings, per-batch consumption and alert thresholds: you correct before wasting nutrient solution.
Less energy
Real greenhouse occupancy and historical parameters: you stop conditioning and lighting empty space.
Less waste
Waste per batch, cycle duration and spread-out harvests: less produce out of window and less unsold stock.
Improves over time
Cycle and batch comparisons, increasingly accurate forecasts: the farm learns from its own data season after season.
Crops and planning
Every batch has origin, stage, quantity and dates. The gantt shows overlapping cycles and free space, so you plan the next sowings on the greenhouse's real capacity and future planning becomes an active batch in one click.
Crop plan · Greenhouse 1
GanttCapacity used
82 %
Planned sowings
9
Upcoming harvests
4
Illustrative example: in the application the plan is built on your batches and the greenhouse's real capacity.
Crops
Direct benefit
The crop plan and what actually happens in the greenhouse stay the same thing, even when dates shift.
Planning
Direct benefit
You produce continuously instead of in waves: fewer empty benches, fewer work peaks and steady supply to customers.
Every day
Calendar
Nutrition, checks and harvests no longer depend on memory: whoever enters the greenhouse finds assigned tasks.
Field logbook
The field logbook fills itself with what you do: no evenings spent rebuilding records before an inspection.
Inventory and orders
Direct benefit
Fewer emergency purchases and less unsold produce: you buy what you need and deliver what you promised.
Analytics
Direct benefit
Every cycle leaves a history: the more you use the software, the better your forecasts and yields get.
Integrations
IoT sensors and controllers for automatic data collection, APIs towards major business systems and accounting, local weather cross-analysed with your numbers, data import and export. Where needed, we build IoT and API integrations tailored to the systems you use.
Bluelab, NidoPro and compatible systems: temperature, humidity, EC and pH synced automatically.
API integrations with major business systems, including accounting and invoicing: data flows without double entry.
Local forecasts and weather history cross-analysed with consumption, yields and planned activities.
CSV in and out to bring your history in and send reports to advisors and customers.
Unusual sensors, machines or business systems? We study your case and build the dedicated IoT or API integration, with data arriving in the format you need.
Integrations and weather
Direct benefit
Data comes in on its own and flows out to accounting: no double entry and nothing left outside the system.
AI and traceability
AI assistant
Useful information arrives in one sentence, with no tab hunting or history rebuilding.
QR and traceability
A product with a story sells better: buyers and retailers find the documentation already in place.
Illustrative previews of the application views: the data shown is sample data.
Features
The features listed here are the ones actually available in the Blue Circle application. Some modules depend on the chosen plan.
Daily priorities, alerts, extended weather and crops in multiple views (list, calendar, gantt, kanban) on a single screen.
Batches with origin, stages (vegetative, flowering, harvest, closed), quantities and dates. Future planning converted into active batches.
Interactive editor to draw greenhouses, sectors, benches and plant slots: see at a glance where each batch sits, which positions are free and which are being harvested, with no spreadsheets or walk-arounds.
The map gives you surface occupancy and future availability, so you plan sowing and transplanting on the facility's real capacity.
One-off and recurring activities, month/week/day/list/kanban views, drag and drop across days.
Readings, notes and the field logbook for recording treatments. Available from the Grow plan.
Built-in variety catalogue and nutrient management with recipes and programmes.
Summaries and charts on batch and cycle performance, batch comparison and exportable reports.
Bluelab and NidoPro connectors with periodic synchronisation and display of environmental parameters; compatible sensors, controllers and control systems bring data into the platform with no manual re-typing.
APIs to exchange data with business systems, accounting, invoicing, e-commerce and tools already used on the farm. We review your systems with you and build IoT and API integrations tailored to your setup.
A chat that reads your real company data — crops, batches, tasks, weather, sensors, harvests — and answers operational questions in plain language: what to do today, how a batch is doing, where the deviations are.
Every batch generates a QR code with a public page: production path, stages and recorded treatments. Put it on crates and labels and any customer or buyer can read the product's story. Manager plan or certified companies.
A public page on the Blue Circle portal with the company profile and available batches, with direct B2B contact.
Email invitations and granular per-collaborator permissions on pages, editing and deletion.
CSV import and data export for external analysis and documentation.
Operational alerts on deadlines, tasks and out-of-range parameters.
Command palette (Ctrl/Cmd+K) across pages, settings, batches, plants and greenhouses.
Stock of nutrients, substrates and packaging, low-stock alerts and customer orders linked to batches.
Local forecasts and history cross-analysed with consumption, yields and planned activities.
Coming soon: Management & Suppliers module with e-invoicing integration.
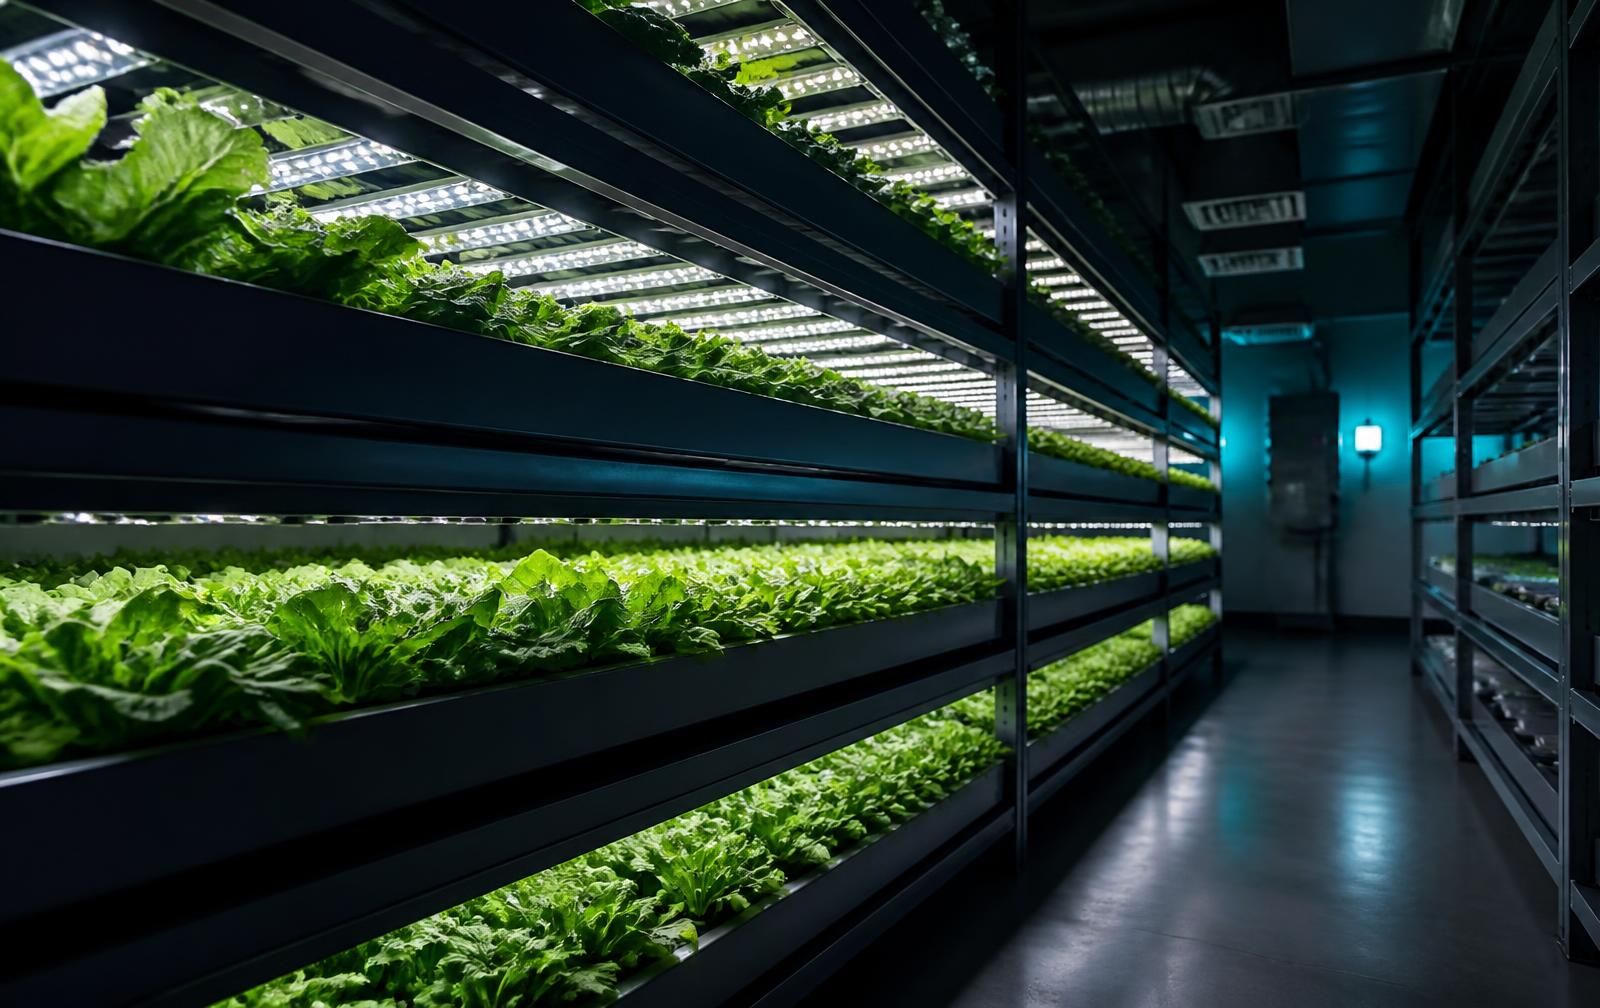
Every production cycle is recorded with crops, activities, consumption and observations: the same data base you later use to analyse performance and support an audit.
How it works
Configure your company and your crops.
Enter and organise your production data.
Turn data into useful information.
Use data and documentation to support audits and certification.
Pricing
Choose the plan that fits the size of your business. All prices exclude VAT and you can change plan at any time.
For getting started
€24.90/month
excl. VAT
For growing businesses
€49.90/month
excl. VAT
For established operations
€74.90/month
excl. VAT
For large organisations
Custom
There is no free plan: signing up starts a 14-day trial with all Manager plan features. Add-on packages for users, AI requests and integrations are available.
| Feature | Base | Grow | Manager |
|---|---|---|---|
| Full management system | |||
| Field logbook | |||
| Users | 1 | 3 | 5 |
| System integrations (API) | 1 | 5 | 10 |
| Invoicing integration | |||
| Monthly AI requests | 10 | 30 | 100 |
| Company showcase | |||
| Economics | |||
| QR batch traceability | |||
| Custom software integrations |
Frequently asked questions
Start the free 14-day trial or book a guided demo with our team.
Want to certify your production model? Discover Blue Circle Certification